
Article de Zhenming Jin
Article de
Visualisation de possibles sites de liaison entre Sars-CoV2 Mpro-N3, et SARS-CoV Mpro-N1
Extended Data Fig. 3
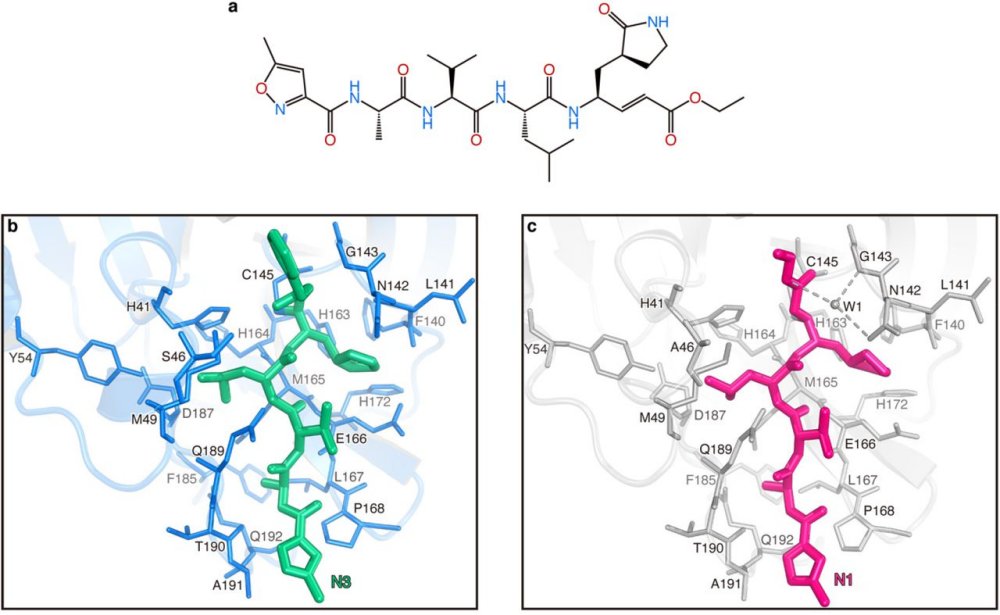
Comparison of the binding modes between COVID-19 virus Mpro-N3 and SARS-CoV Mpro-N1.
a, The chemical structure of N1 inhibitor. b, The binding mode of COVID-19 virus Mpro (blue sticks) with N3 (green sticks). c, The binding mode of SARS-CoV Mpro (grey sticks) with N1 (pink sticks). The hydrogen bonds formed by water (W1) are indicated by the dashed lines.
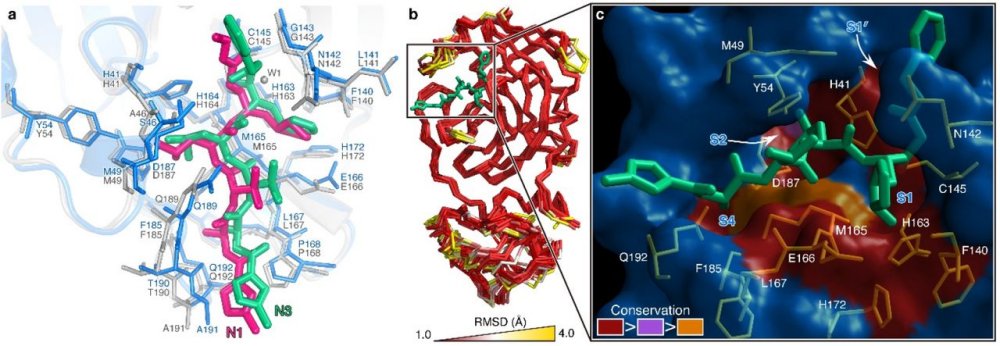
Fig. 2 The substrate-binding pockets of CoV Mpros across different species.
a, Comparison of inhibitor binding mode between the structures of COVID-19 virus Mpro-N3 and SARS-CoV Mpro-N1. COVID-19 virus Mpro is shown in marine cartoon; SARS-CoV Mpro in grey; N3 in green sticks; N1 in hot pink. b, Superposition of crystal structures of Mpros (Cα 1-300) from 12 CoVs, including COVID-19 virus, SARS-CoV, MERS-CoV, HCoV-HKU1, BtCoV-HKU4, MHV-A59, PEDV, FIPV, TGEV, HCoV-NL63, HCoV-229E and IBV The color spectrum represents the root-mean-square deviation (RMSD) of the aligned Cα atoms. c, Surface presentation of conserved substrate-binding pockets of 12 CoV Mpros. Red: residues are entirely identical among all 12 Mpros; violet: conserved substitution in one CoV Mpro; orange: conserved substitution in more than one CoV Mpros. S1, S2, S4, and S1’ subsites are indicated.
 |
Séquences 3CLPRO-COV1-COV2.edi Pour visualiser les sites illustrés dans ces images |